Chapter 5 Results
5.1 Evaluate the performance of teams and players with a new rating
We are going to see how commonly used indicators impact the final score.
We generated standard indicators used by event organisers and sites from the datasets:
‘kpr’ : average number of kills per round
‘adr’: average damage per round
‘first_kill_ratio’: ratio of the time where the team or player gets the first kill (which grants a numerical advantage)
‘smokes_per_round’: average number of smokes thrown in a round
‘assist_ratio’: ratio of kills assisted by another player that dealt more than 40 points of damage
‘non_traded_ratio’: ratio of kills where the victim team could not get a revenge to prevent a numerical advantage
‘avg_flash_duration’: average time of blinded enemy players caused by flash grenades
‘blinded_ratio’: ratio of kills where the victim was blinded by a flash grenade
‘strafing’: ratio of kills where the attacker was strafing i.e. was sidestepping to avoid being immobile to the opposing player
‘hs_ratio’: ratio of kills where the attacker landed a shot in the enemy’s head, resulting in more damage points

We can see that some indicators are more correlated than others to the relative score difference (difference of the winner’s and loser’s scores over the sum of the scores). For instance, the kpr indicator has a correlation score of 0.6 with the relative score difference and thus can be used to evaluate a player’s performance. On the contrary, the strafing and hs_ratio indicators have little to do with a team’s success. Overall we can see that ‘kpr’ (ie:average number of kills per round), ‘adr’ (ie: average damage per round) and ‘first_kill_ratio’ are three indicator variables that have a stronger positive correlation with the relative score difference
A PCA analysis better helps visualize indicators that better reflect a team’s chance of winning.

Indicators with directions opposite to the loosing matches and closer to the correlation circle are the most interesting ones. As we can see, the PCA analysis confirms the findings with the correlation tests. It also tells us that many of these indicators are themselves correlated since the angle between their arrows is very small: the principal components were not able to separate these features in the reduced space. It is not surprising that the number of kills, the number of damages and the number of assists are very correlated. Nonetheless, it is interesting to notice that the number of first kills of a team is also correlated to these metrics; an early numeric advantage in the match thus definitely give an advantage to a team.
Note that there is no indicator with a strong correlation (more than 0.7) with the score difference. But combining those indicators can still lead to a better overall rating score. We are going to achieve it with a multi-variable linear regression.
##           (Intercept)                   kpr                   adr
##          -2.159001804           1.098123208          -0.008680566
##      first_kill_ratio    grenades_per_round attack_grenades_round
##           0.556314728           0.129022010          -0.097033872
##      smokes_per_round          assist_ratio      non_traded_ratio
##                    NA          -0.013587043           0.908901056
##    avg_flash_duration
##           0.012487306
5.2 Teams performance
With a new combined rating, we can take a closer look at each team’s performance relative to each other
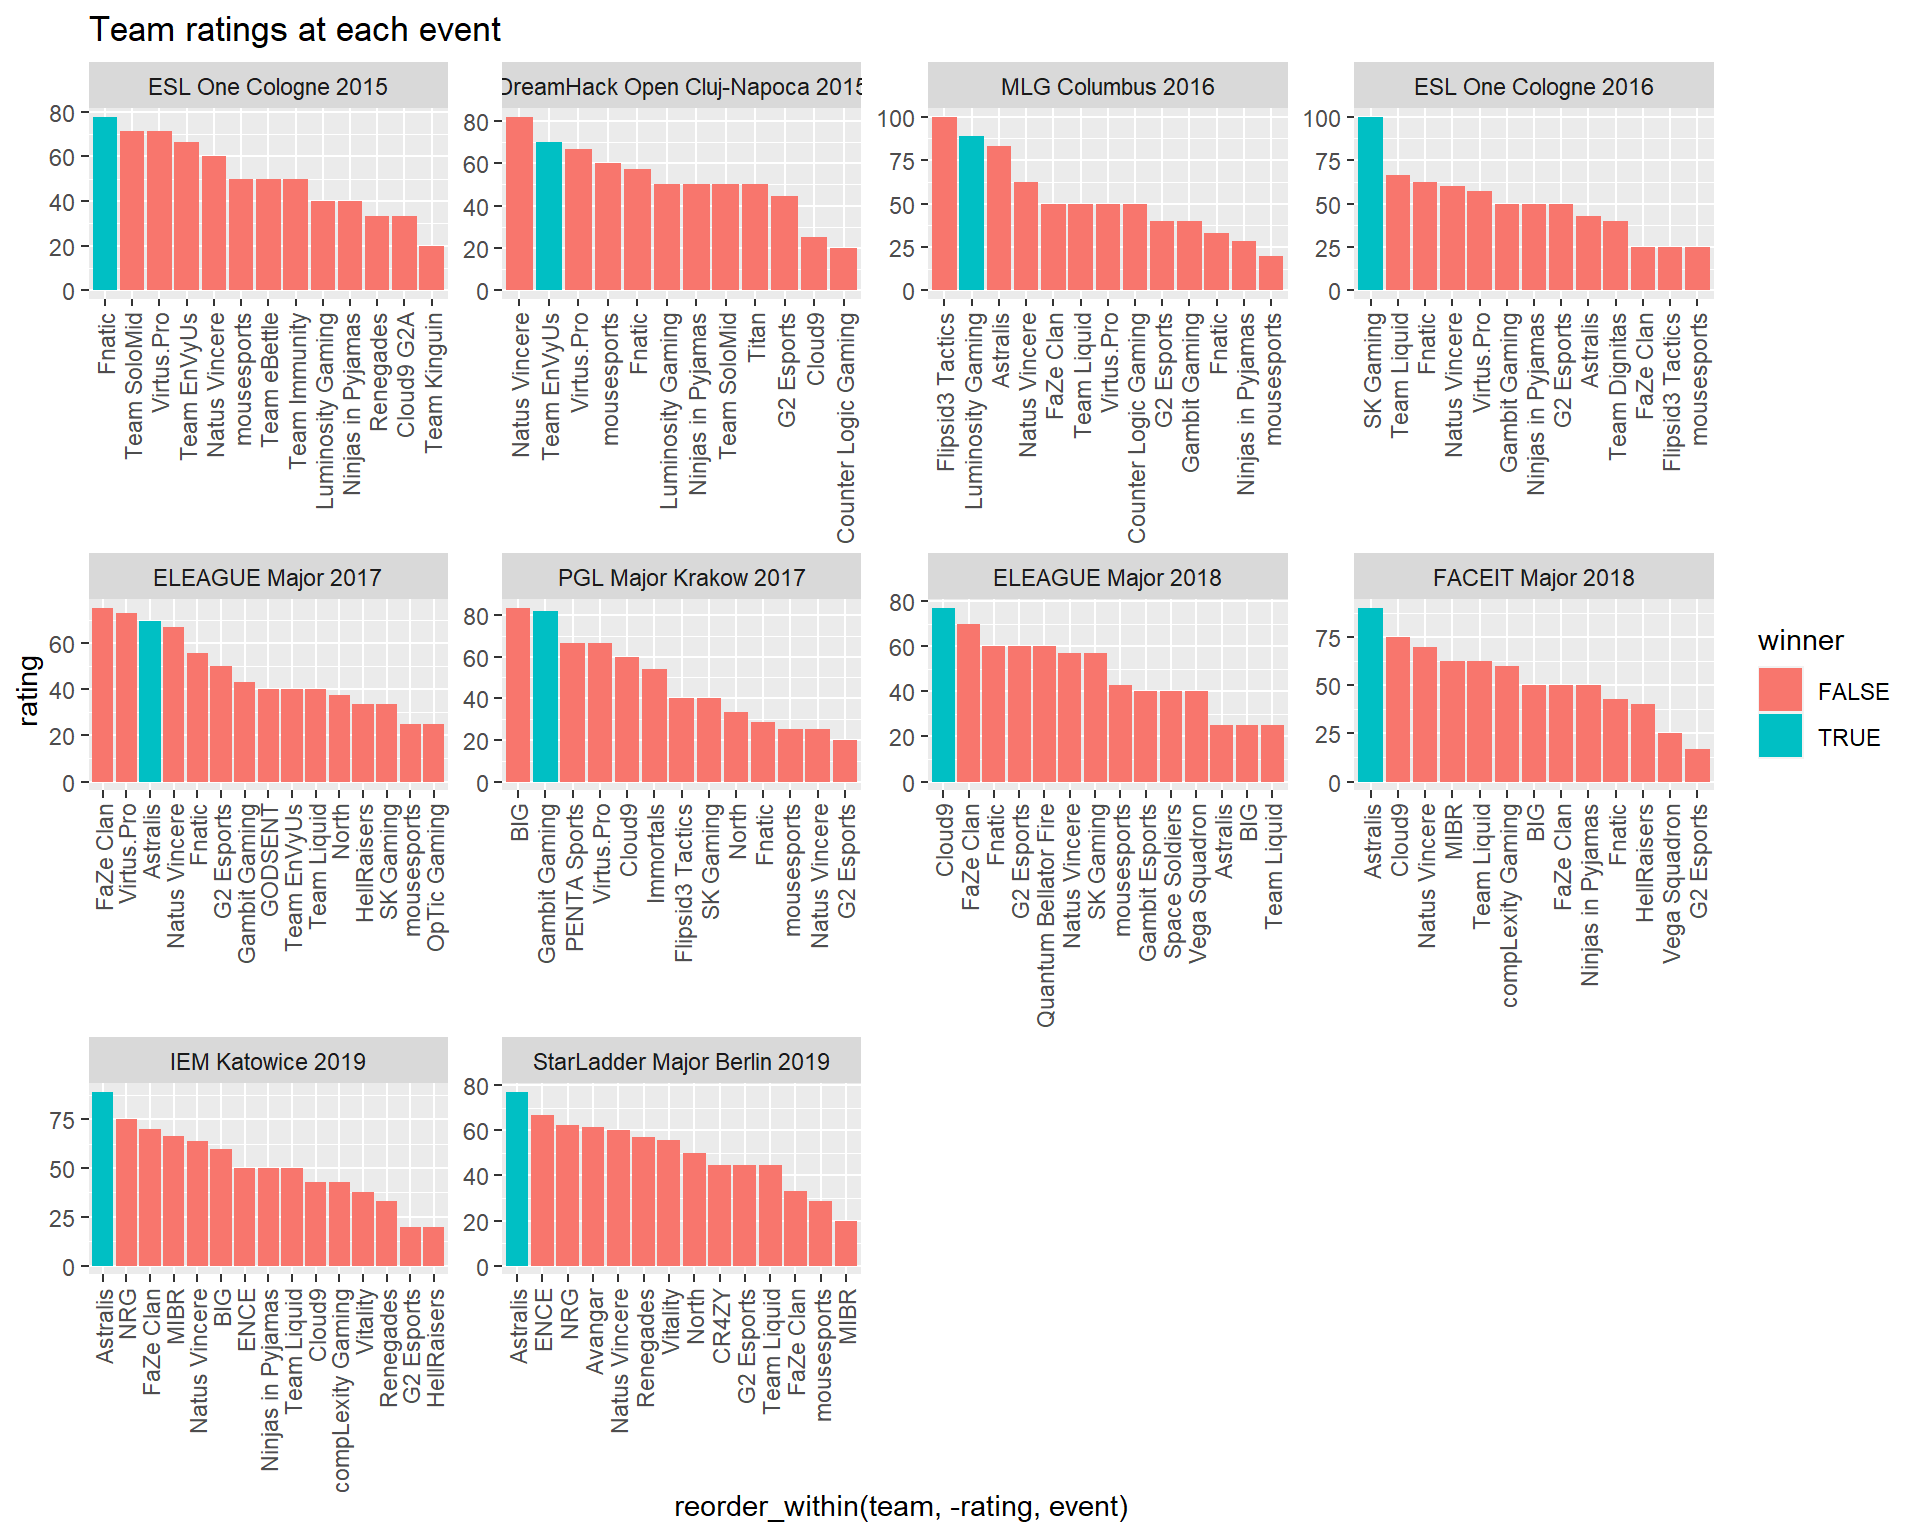
As expected the winning team is consistently in the top team ratings. 6 times out of 10, the winning team has the best rating between 70 and 100. However, sometimes, some teams get even better ratings than the winner. This is explained by the fact that some teams have a solid performance throughout the tournament, only to get eliminated in the final stage. For example, in the Eleague Major 2017 event, Virtus.Pro was eliminated by Astralis in the finals, and Faze Clan got eliminated in the quarter-finals. [1]
5.3 Players performance
Events and websites like HLTV generally focus on player’s performance at individual events. However, it would be interesting to look at a player’s performance across all events. This would smooth out players that had an unexpectedly good or bad performance in an event.
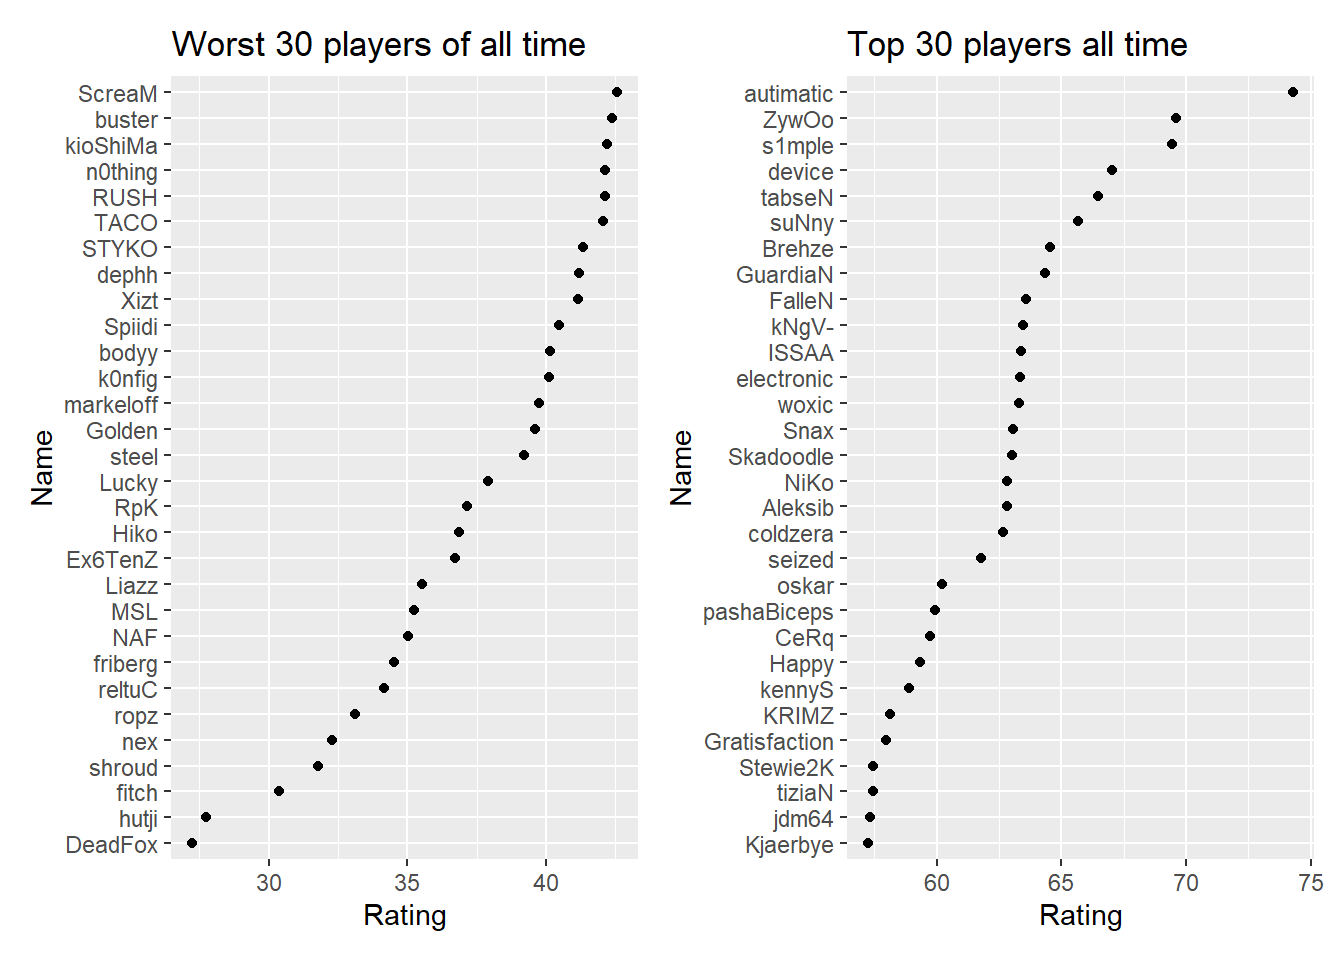
The rating is derived from the combined effort of the player considering various parameters like average kills per round, damages through grenade, headshot, ratio of first kills, duration of flashes etc.
The player Autimatic has the highest rating of all and has one win with his team Cloud9 in the Boston Major. Interestingly, Zywoo, s1mple, and device are the immediate 3 highest rated players after autimatic. The fact that those three players where nominated in the top 3 players in 2018 and 2019 by the HLTV website means that our combined rating reflects the different ratings of other sites such as HLTV. Note that the player Zywoo started his career in 2018, and thus is not in the top player ranking of this year. [2], [3], [4]
There is almost 20 points of rating score difference between the top-rated player and the 30th best-rated player. The same can the said for the worst-rated players. As a result, it is quite easy to differentiate players as the ratings are not too close to each other.
It is often hard to compare teams and players across events because players often change teams. One way to cross the information is to visualize the teams of a player:
This shows how players changed teams throughout various events and how few players remained in the same team for multiple events.
For instance, players Flamie and Edward remained in the team Natus Vincere for multiple events.
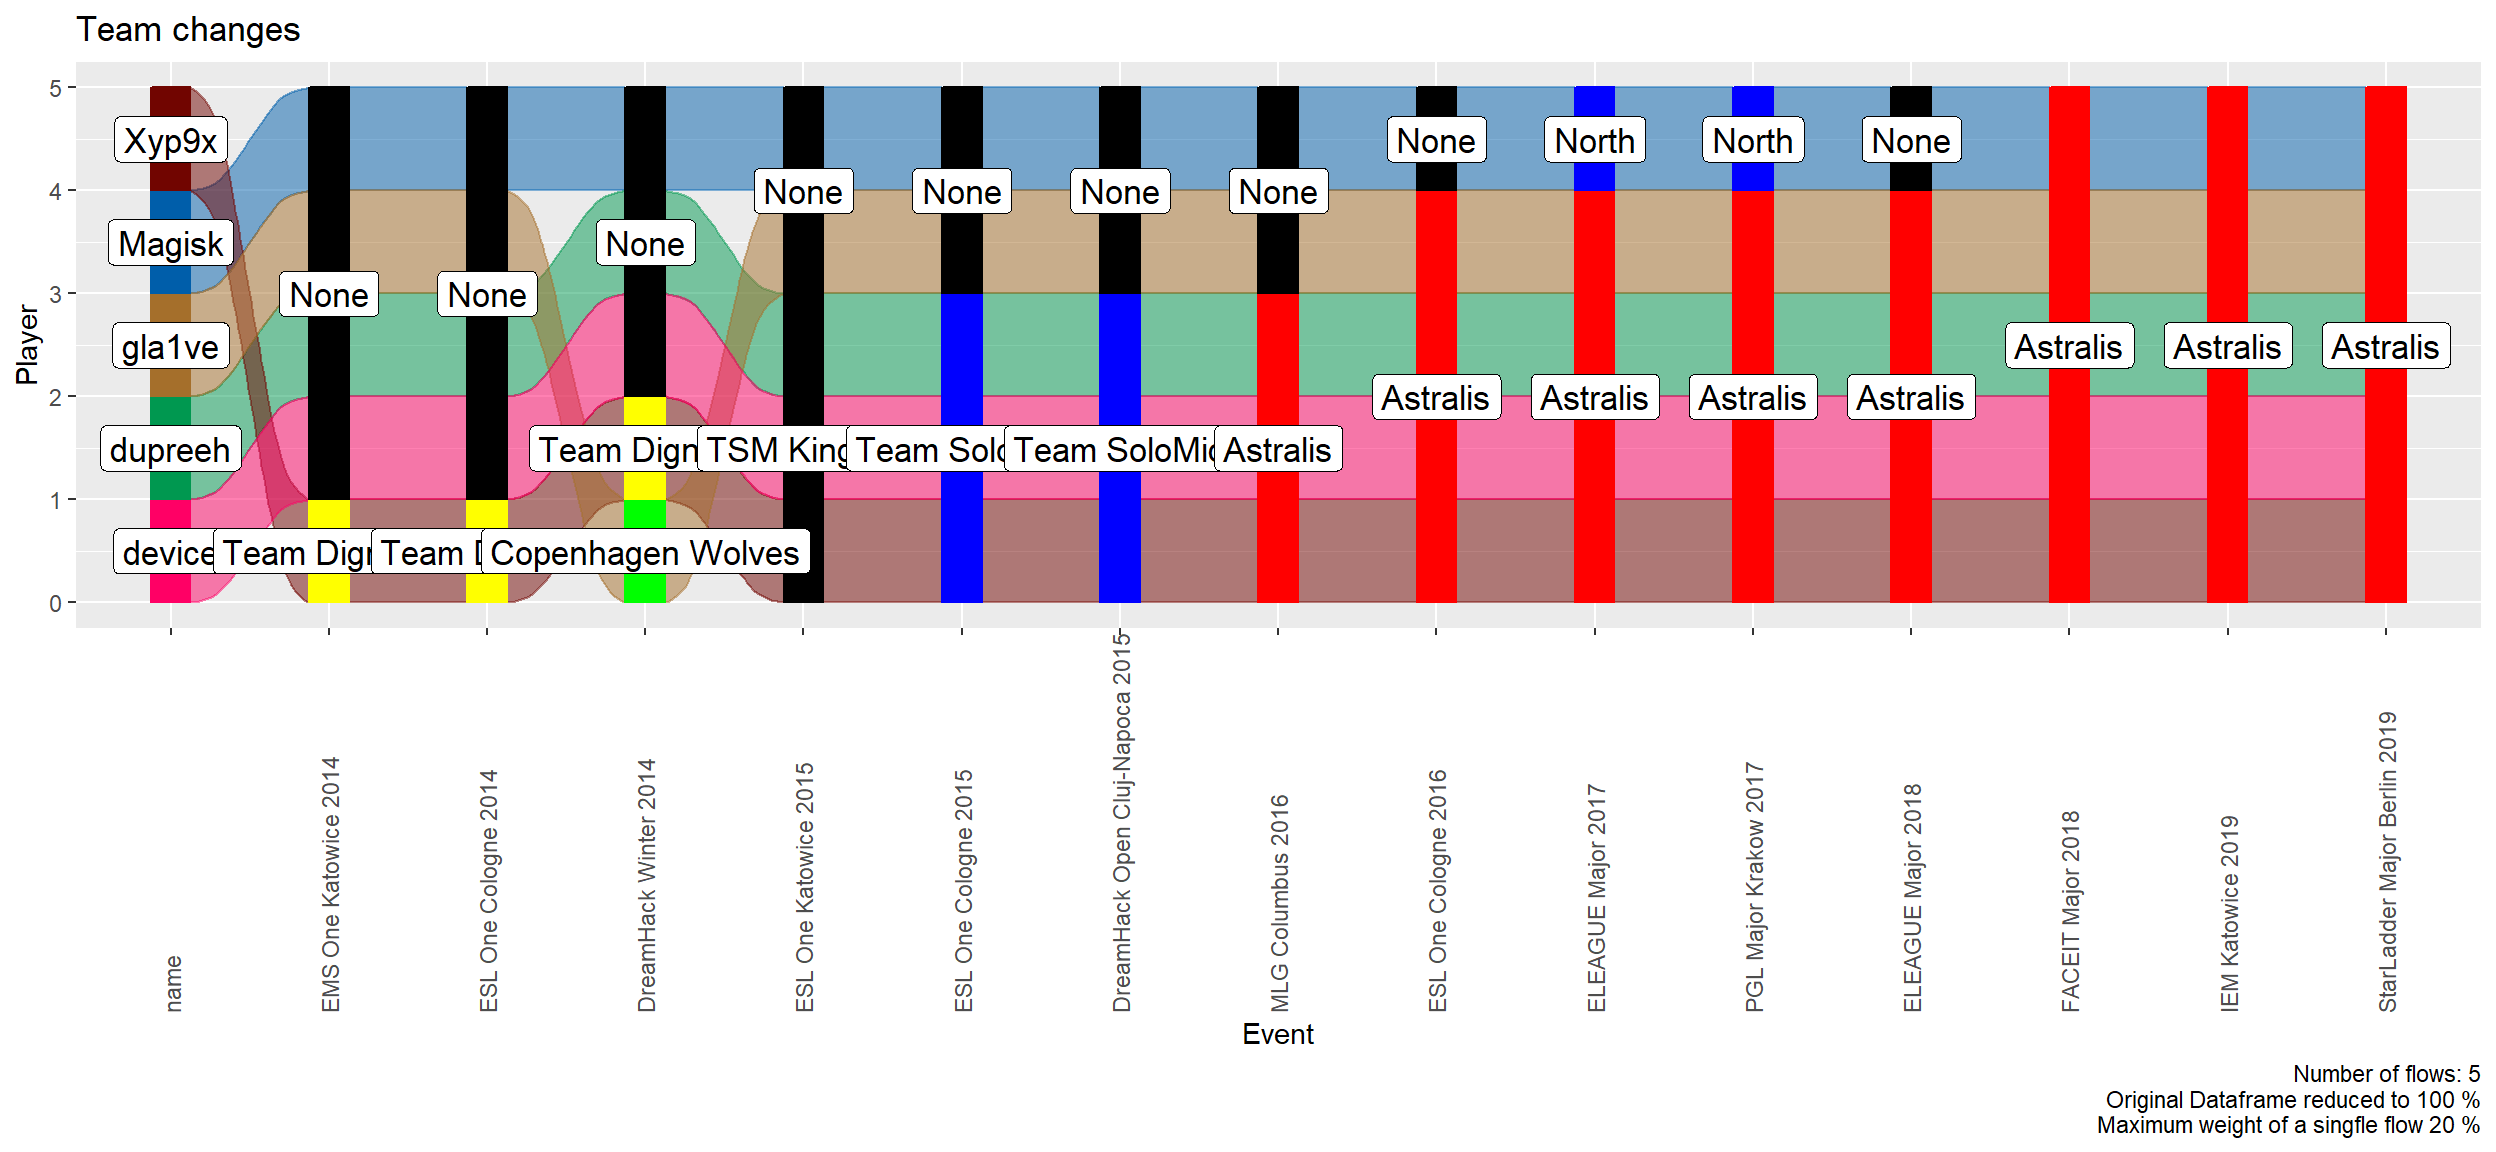 One of the most successful teams is Astralis with 3 Major wins. A core of 3 players (dupreeh, device, and Xyp9x) have been playing together for 10 events explaining the team’s consistent success.
5.4 Use in-game data to have the competitive advantage
The game data of matches is available to everyone and pro teams always watch their opponent’s previous games to come up with strategies.
However, watching games takes time and some parts of this process can be automated.
Even though it does not give information such as a team’s reactions to specific events, 2d-density maps can give the general trends, and habits of a team or player.
For instance, one of the hardest players to play against is s1mple, especially with the AWP weapon because of its range. Parsing the game data allows to know where players can expect s1mple to be and where he can be aiming at with his weapon.
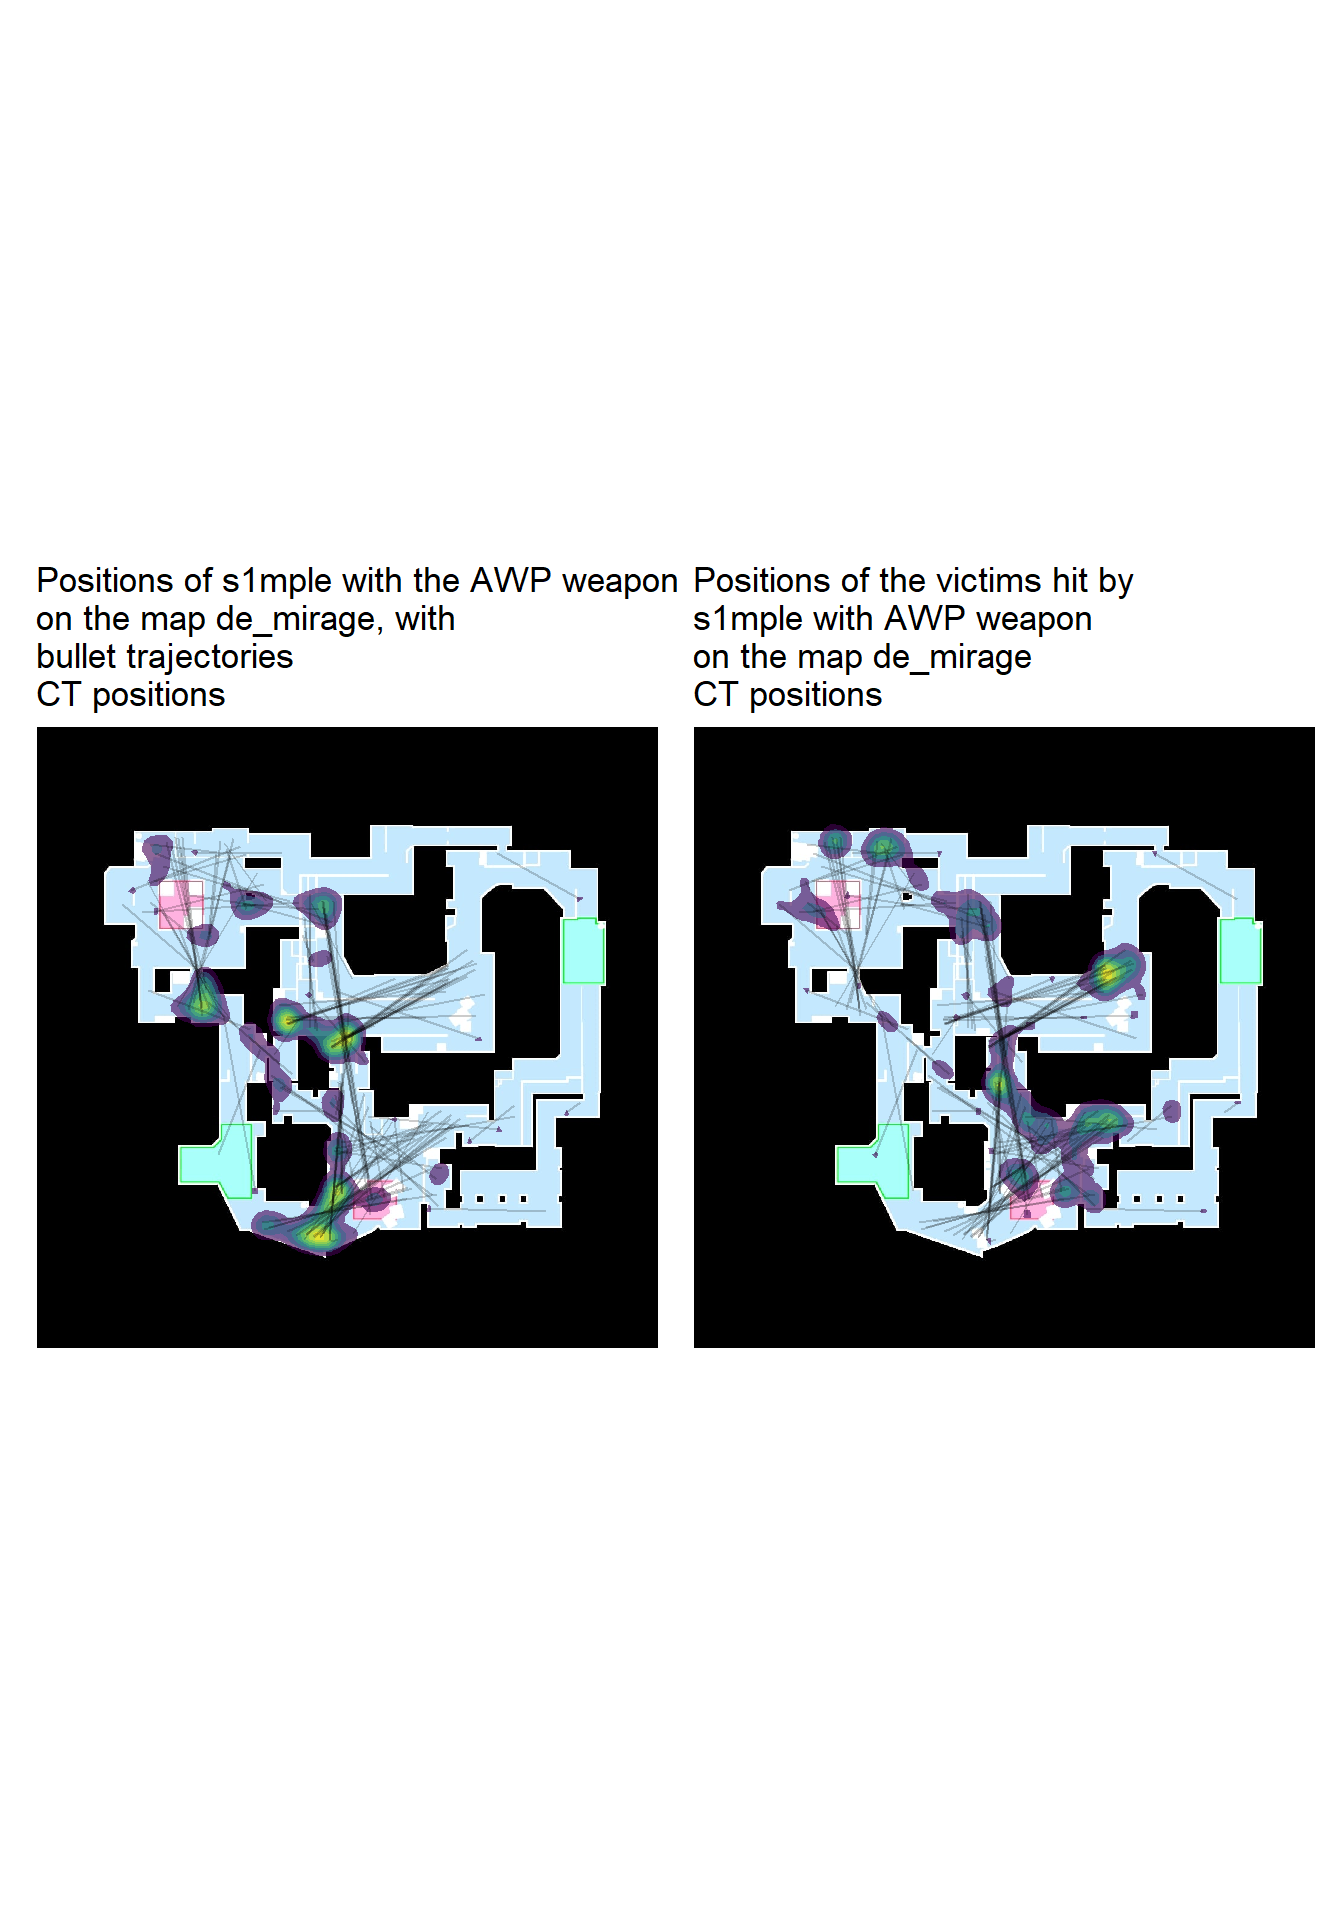
Knowing the habits of a player and the positions where it is dangerous to be can avoid being surprised by the enemy and helps to come up with strategies to counter the enemy team. We can see in yellow where s1mple tends to be when he deals damage, and where the victim’s positions are. The trajectories allow linking those two positions. We can see that s1mple often takes tight lines where the trajectory is tangent to a corner of a wall.
5.5 Game evolution and balance
People often attribute the success and longevity of the CSGO game to its balance, meaning that both teams have an equal chance of winning. However, this is difficult to achieve as it depends on multiple factors such as the weapon characteristics and map layout.
Because the developers have been continuously updating the maps and weapon characteristics, the probability to win a round on the T/CT sides has changed over the years.
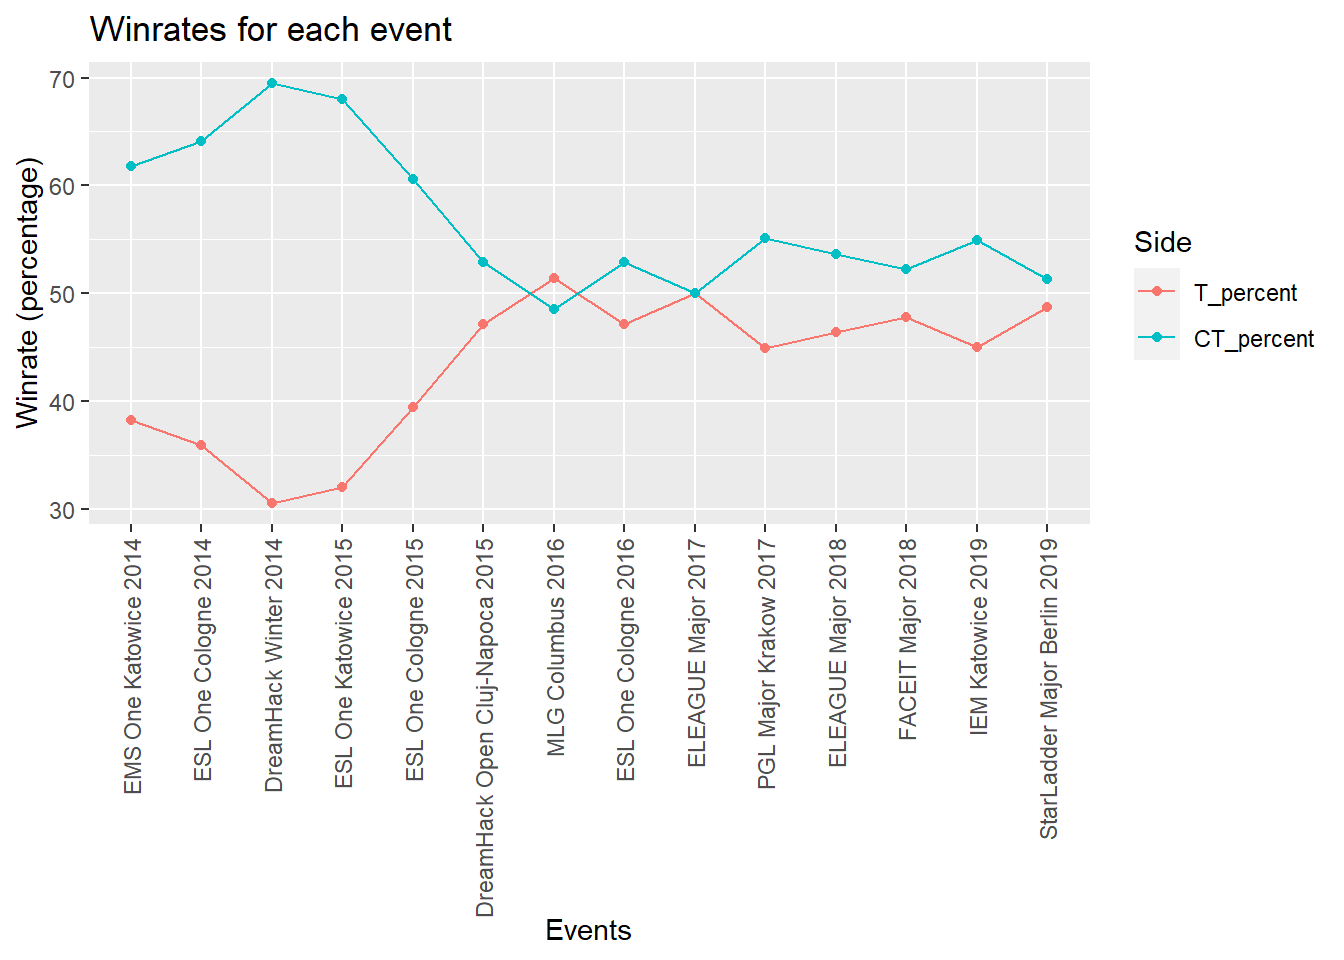
The drop in the win percentage differences after 2016 can be attributed to the update of the nuke, inferno, and overpass maps. Maps updates often include changes in the layout to give more advantage to a given side.
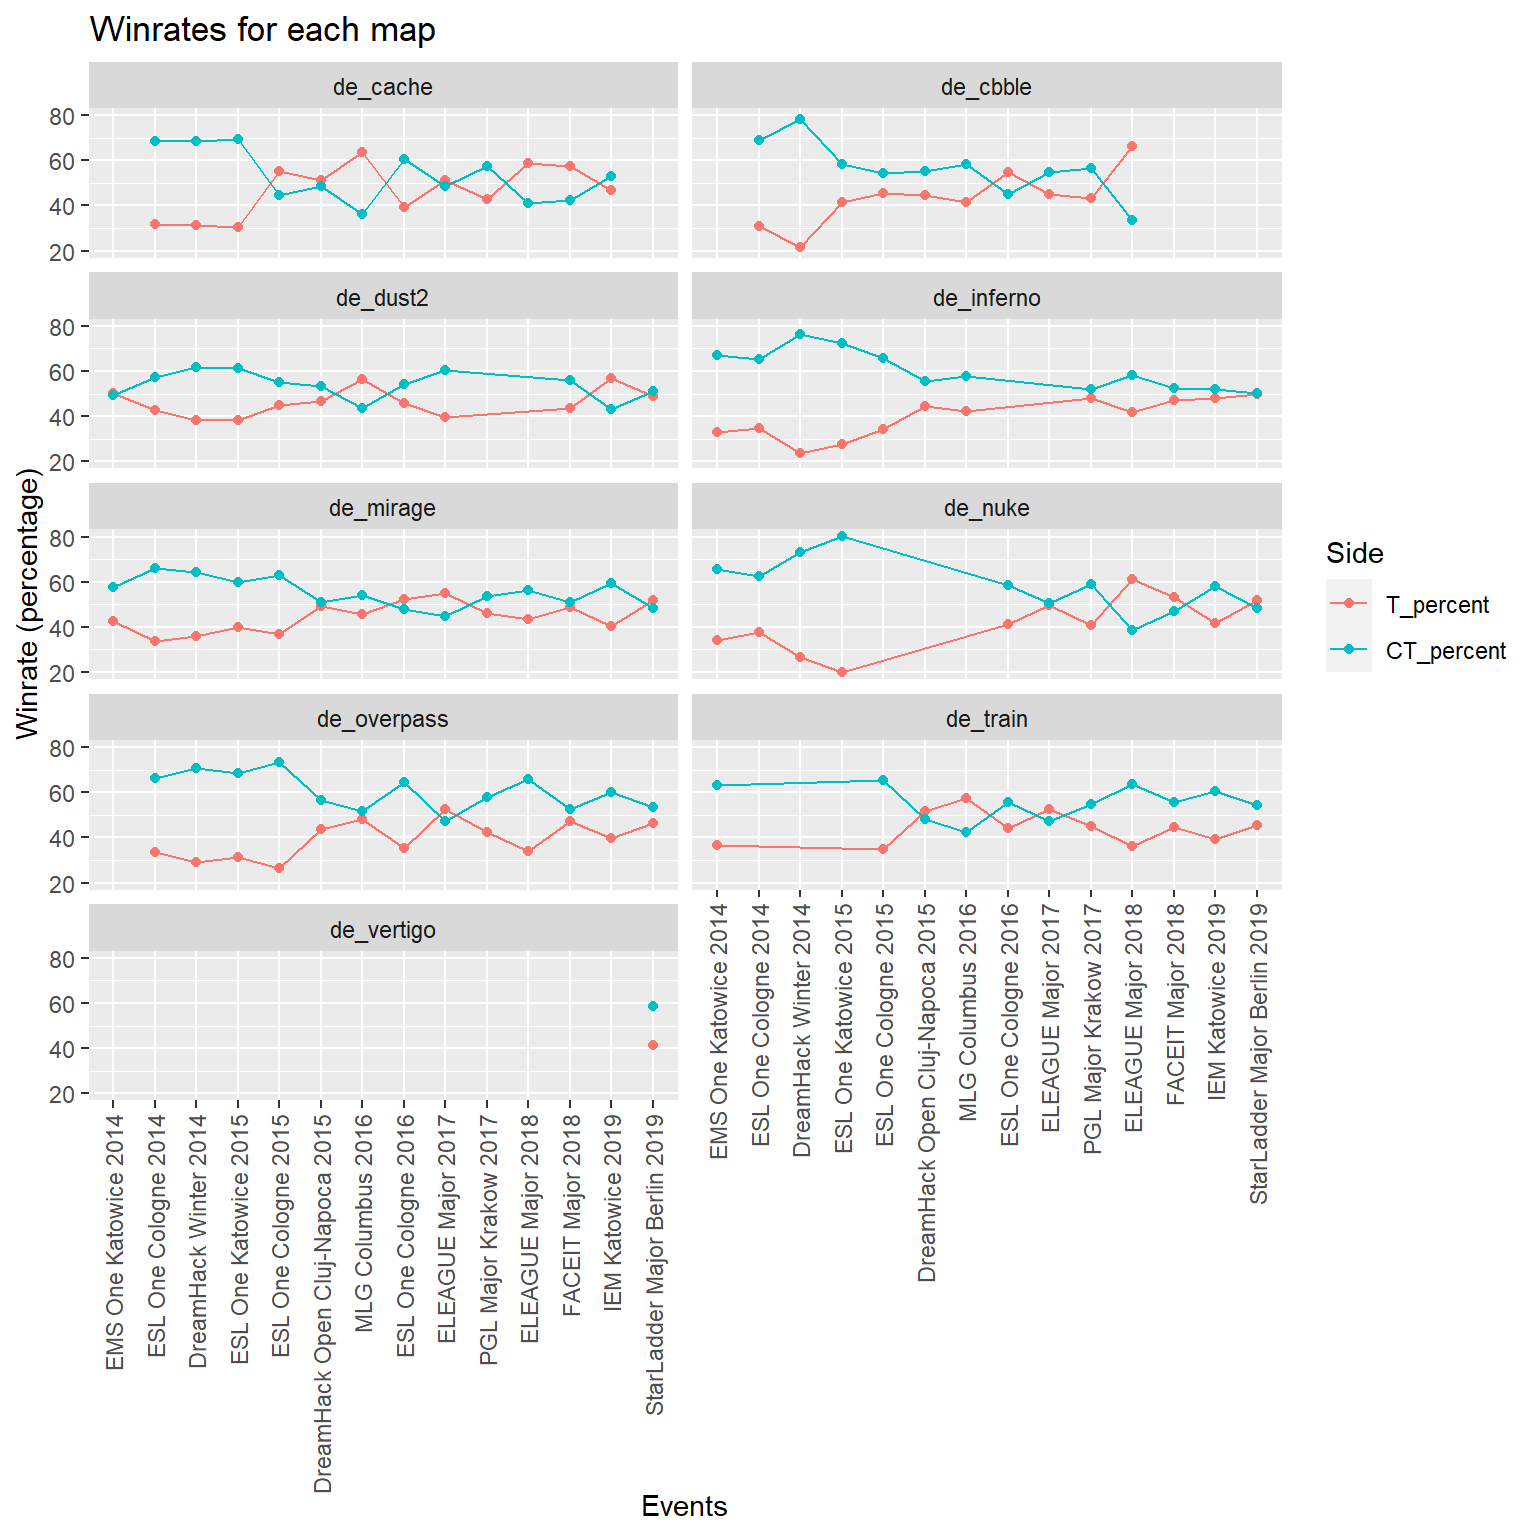
In CS:GO tournaments, teams can play on a range of different map layouts. Professional teams often spend hours training on these maps, so it is interesting to see win-rate across different maps.
Nuke has been removed from the official maps after Katowice 2015 and reintroduced for Cologne 2016. [5] It was known to greatly favor the CT side, often forcing the team starting on the T side to have an impressive comeback after switching sides on the halftime. Of all maps, nuke had the worst balance especially during Dreamhack Winter 2014 with a CT win rate of 80%.
But after the nuke map update, the balance greatly improved and the CT and T win rates were contained between 40% and 60%. In fact, in 2019 all maps were balanced with win rates between 40% and 60%, with de_inferno, de_dust2, de_nuke, and de_mirage being particularly balanced (win rates close to 50%). Overall, the Starladder Berlin Major 2019 event seems the most balanced Major ever. It is safe to say that game updates generally improved the balance of the game.
Note that the map pool changes for every event. The latest map being introduced is vertigo. Because it is a new map, it is not as balanced as the other ones.
Weapons also impact the game balance.
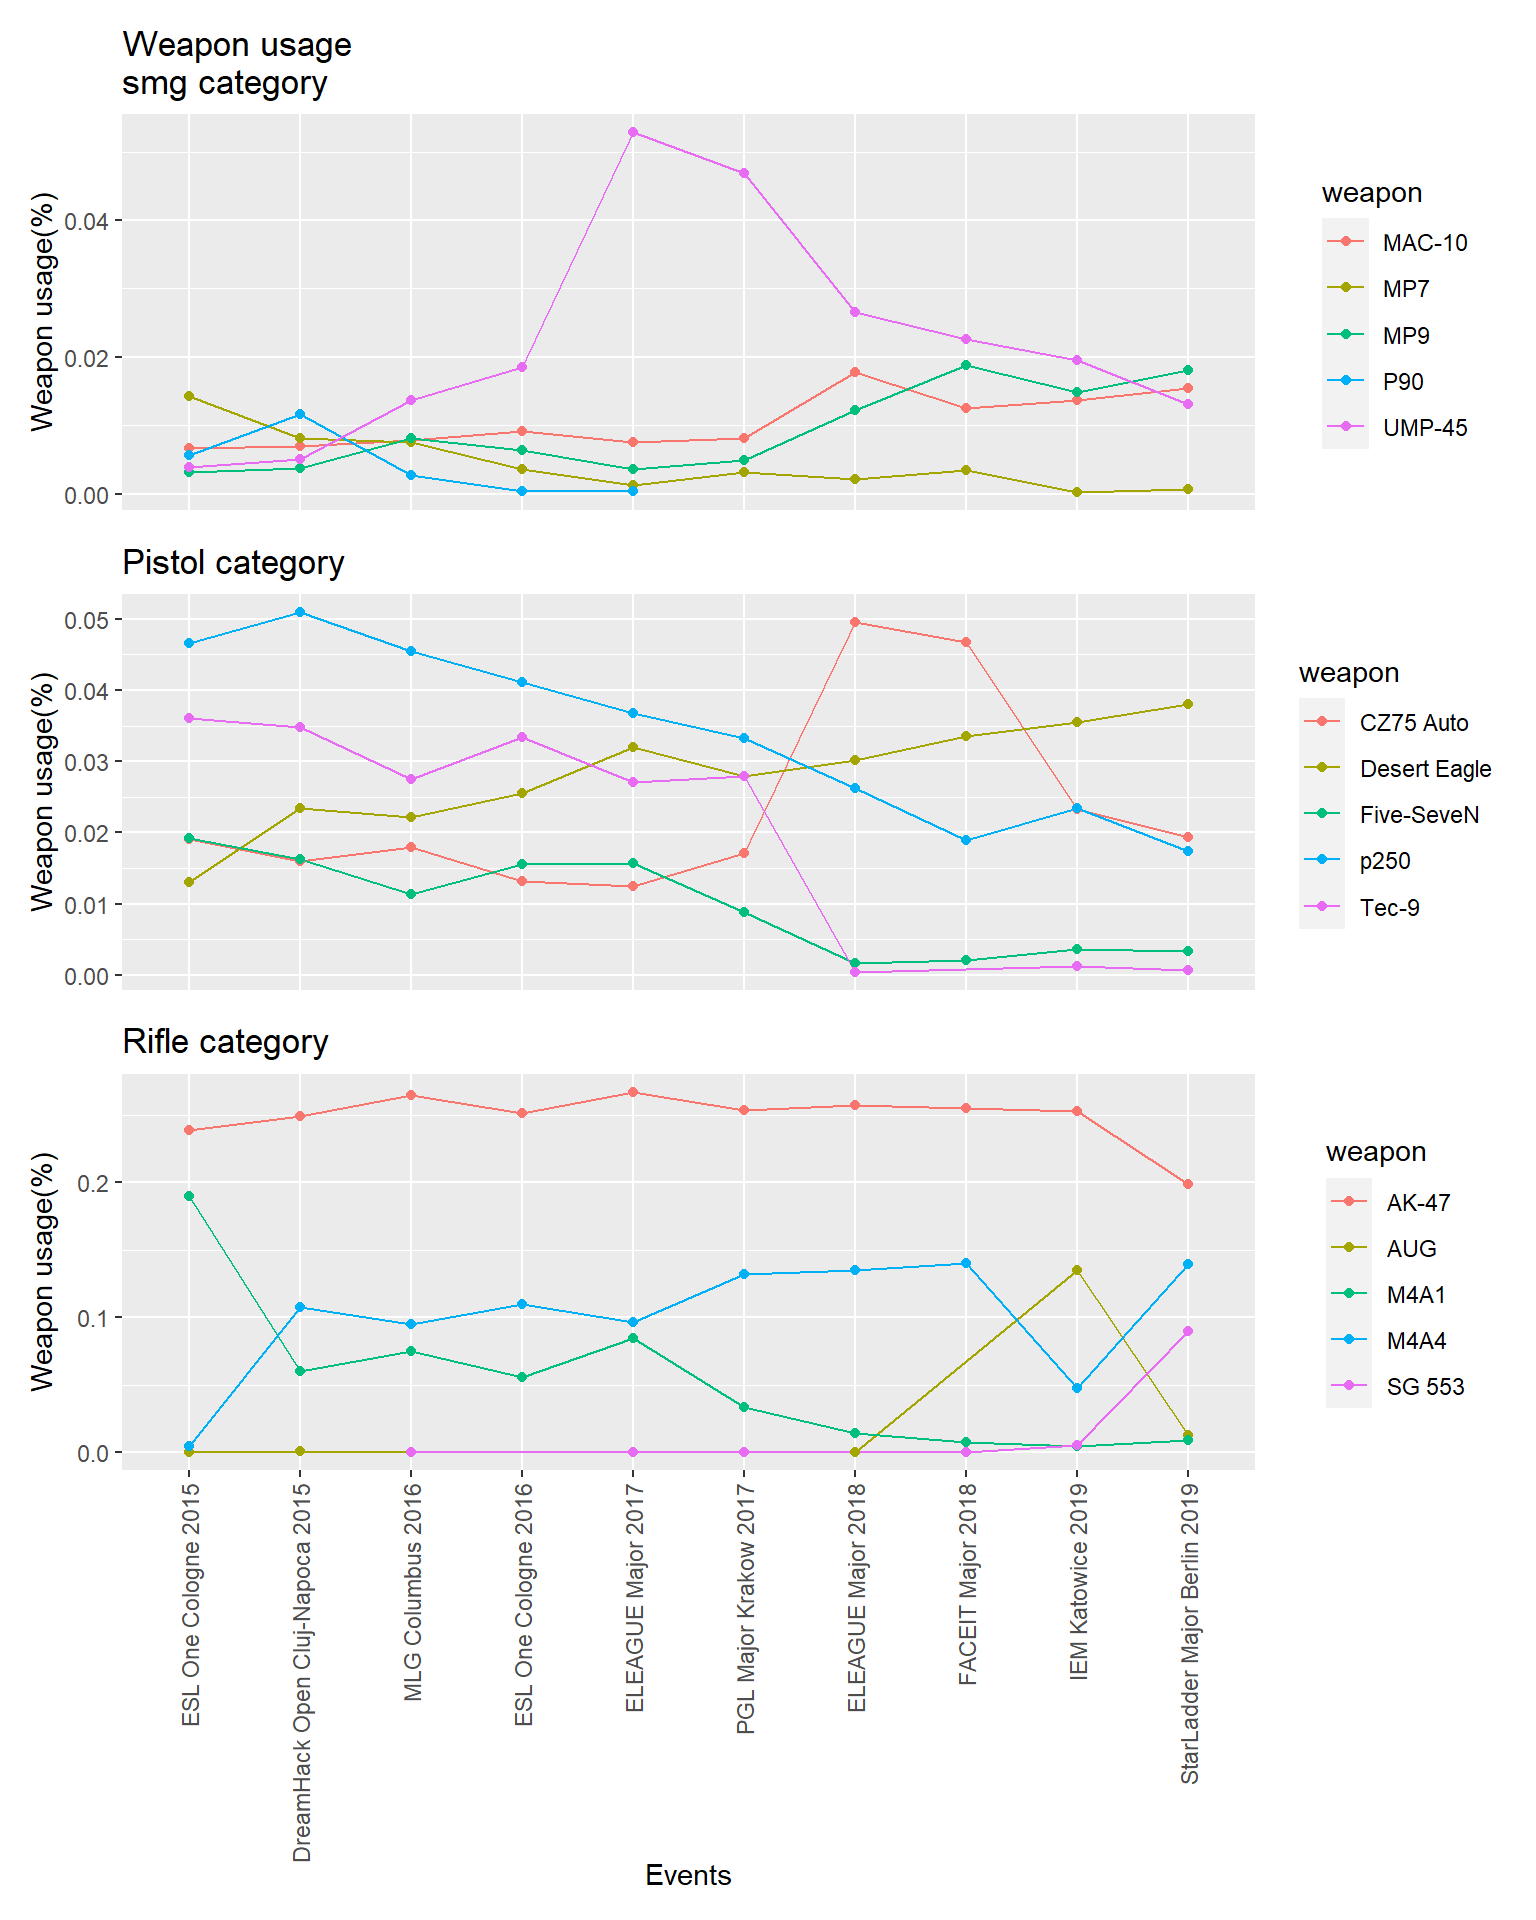
When the developers change a weapon’s characteristics such as damage output, it can lead to a drop or spike in popularity.
For example, in 2017 developers tried to increase the usage of smg type weapons by increasing their damage output, especially for the ump. As a result, the ump was often used by teams when they could not get a rifle. But complaints from pro players meant that the update was reverted. [6]
The same can be said for the cz-75 in 2018. Also, the p250, five-seven, and tec-9 had their damage and accuracy decreased over the years and resulted in a drop in usages by the pro players.
Finally, it happens that players discover that a weapon can be very effective, even without its characteristics being changed. This is what happened in 2019 when players started to use the AUG and the SG 553 weapons for their good accuracy at long range. As a result, their effectiveness has been reduced in a later update. [7]
[1] Eleague Major 2017, Overview page, HLTV.ORG
[2] OFFICIAL: VITALITY UNVEIL TEAM, MIRAA, 2018HLTV.ORG
[3] Top 20 players of 2019: INTRODUCTION, Striker, 2019 HLTV.ORG
[4] Top 20 players of 2018: INTRODUCTION, Professeur, 2018 HLTV.ORG
[5] NEW UPDATE ADDS NUKE TO ACTIVE DUTY, stich, 2016, HLTV.ORG
[6] NEW UPDATE CHANGES THE UMP45, Sander, 2017, HLTV.ORG
[7] Release Notes for 4/10/2020, Valve, 2020, update notes